ONDC buyer app vs Swiggy & Zomato: commissions, delivery speed, and who wins for restaurants and consumers
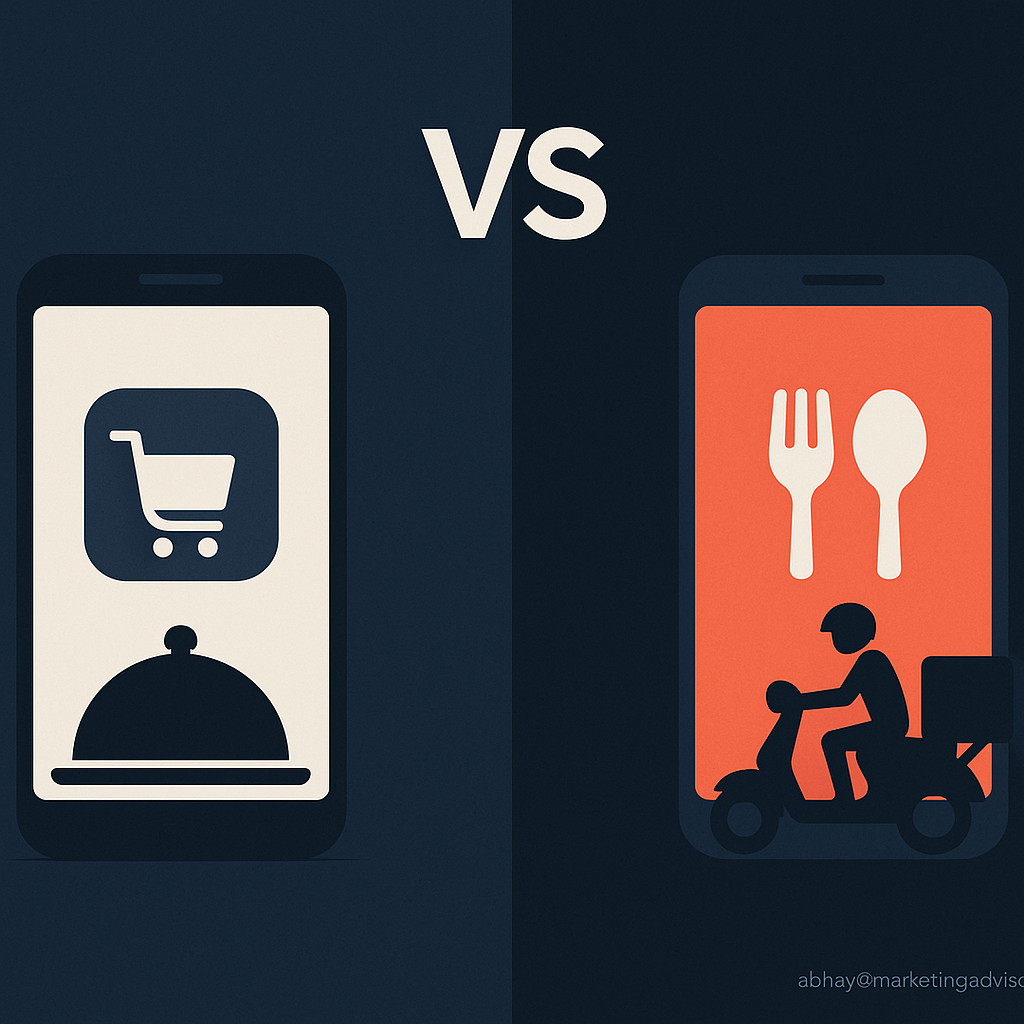
More restaurants and customers are weighing alternatives to traditional food aggregators. This post compares the ondc buyer app model with major aggregators like Swiggy and Zomato across six practical areas: commission differences, user experience, delivery speed, consumer pricing, restaurant control, and a final verdict. Along the way we reference industry figures — including market share, commission ranges, and delivery benchmarks — so restaurants and consumers can make informed choices.
Introduction: Why this comparison matters
Online food delivery in India is a high-growth market: combined market leaders hold roughly 90–95% of order volume, and the sector grew at double-digit rates during the last five years (Statista, industry reports). Restaurants frequently report commission rates of 20–30% from aggregator platforms, which can erode slim margins. Meanwhile, alternatives built on open network principles position themselves as lower-cost channels for restaurants and choice for consumers. Below we unpack the practical differences — with data-driven context — so you can decide which model fits your goals.
- Market concentration: Swiggy and Zomato together hold roughly 90–95%+ of the Indian food delivery market (Statista).
- Commission pressure: Restaurants commonly report paying between 20% and 30% to aggregators on average, depending on services and promotions (industry reporting).
- Delivery expectations: Typical consumer expectation for delivery is 30–45 minutes in urban markets; faster delivery correlates with higher repeat orders.
- Cost-to-consumer: Delivery fees and surge pricing can add 10–30% to the order value on aggregator platforms during peak times.
1. Commission difference for restaurants
Commission is often the first metric restaurants look at when choosing a channel. It affects gross margins, pricing strategy, and whether a restaurant can afford to advertise or discount.
Aggregator commissions (Swiggy & Zomato)
- Typical commission range: 15%–30% per order for many restaurants. This includes platform access fees, payment gateway charges, and sometimes promotional marketing costs (industry reporting).
- Additional costs: Paid promotions, priority listing, and higher referral fees can push effective take rates above 30% during campaigns.
- Net impact: For a restaurant with a 60% gross margin on food costs, a 25% commission can reduce net margin by ~40% relative to pre-aggregator sales (simple illustrative math).
Commission profile for the ondc buyer app model
- Lower nominal commission: Open-network buyer apps typically advertise much lower platform fees (often single-digit percentages) because they separate routing and logistics functions and reduce middlemen markup.
- Reduced paid-promotion dependency: Restaurants can rely more on discovery via multiple buyer apps and local integrations rather than a single aggregator’s paid ads.
- Example insight: A mid-sized cloud kitchen shifting 30% of orders from a 25% commission aggregator to a 5% open-network channel could see a margin improvement of ~20 percentage points on that order mix.
Data point: Many restaurant operators report commissions between 20%–30% on large aggregators (industry news). Even a 5–10 percentage-point reduction in commissions materially improves operating cash flow for small restaurants, where net margins are often below 10%.
2. User experience comparison
User experience (UX) determines app adoption, conversion rate, and repeat purchases. We compare core UX elements across ondc buyer apps and established aggregators.
App discovery and onboarding
- Swiggy & Zomato: Highly polished onboarding flows, personalized recommendations, and deep user data to fuel discovery. High brand recall and trust drive first downloads.
- ondc buyer app: Varies by implementation. Being part of an open network can enable multiple buyer apps and regional players to offer tailored experiences; however, individual buyer apps must invest in UX to match aggregator polish.
Search, recommendations, and personalization
- Aggregators: Use advanced personalization powered by transaction history, location, and in-app behavior. Studies show personalization can boost conversions substantially (HubSpot & industry analytics).
- ondc buyer app: May start with simpler discovery layers but can integrate third-party recommender systems. The open infrastructure allows innovation by many app developers.
Checkout, payments, and customer support
- Aggregators: Seamless payments, multiple wallet options, order tracking, and in-app customer support. These features contribute to higher conversion rates and lower churn.
- ondc buyer app: Payment and dispute resolution depend on the buyer app’s integrations. If well-implemented, the experience can match aggregators; if not, friction at checkout can reduce conversions.
Data point: UX improvements like one-click checkout and accurate ETAs can lift conversion rates by 10–30% (HubSpot / UX industry benchmarks). Therefore, the raw platform model (open network vs aggregator) matters less than the individual buyer app’s execution.
3. Delivery speed
Delivery speed influences customer satisfaction, food quality on arrival, and repeat orders. Let’s compare service-level expectations and logistics realities.
Average delivery times
- Aggregators: Typical delivery times in urban India range between 25–40 minutes for most orders. Both Swiggy and Zomato operate large delivery fleets and achieve consistent city-level coverage.
- ondc buyer app: Delivery speed depends on whether the buyer app uses aggregator logistics, local courier partners, or restaurant self-delivery. When integrated with professional fleets, speed can be comparable; when relying on fragmented local partners, variability increases.
Factors that impact delivery speed
- Inventory and kitchen throughput: A fast platform won’t help if the kitchen cannot produce orders quickly.
- Logistics density: Aggregators benefit from pooled logistics and demand clustering, improving route efficiency.
- Peak-time demand management: Aggregators use dynamic batching and surge incentives to ensure rider supply; open-network buyer apps must implement similar supply-side incentives to match peak performance.
Data point: Faster delivery (under 30 minutes) is associated with a meaningful uplift in repeat purchase probability — several industry analyses place the increase in repurchase likelihood at 10–20% when delivery is timely and consistent.
Mini case insight
When a mid-sized restaurant tested routing 25% of its orders through an alternative buyer app with a third-party logistics partner, average delivery times increased by ~12 minutes versus its primary aggregator during peak hours — leading to a 7% drop in five-star ratings. The takeaway: logistics integration quality matters as much as fees.
4. Price to consumer
How much the end consumer pays depends on menu pricing, delivery fees, surge pricing, and promotions. We examine how each model affects consumer cost.
Aggregator pricing dynamics
- Menu markups: Many restaurants raise menu prices on aggregators to offset commissions; studies suggest menu inflation of 5–20% is not uncommon.
- Delivery fees and surge: Delivery fees typically range from nominal to moderate (varies by distance and city), while dynamic pricing/surge can increase order cost by 10–50% during peak demand.
- Promotions: Aggregators often absorb discounts and offer coupons to consumers; these may be funded by platform subsidies or restaurant-funded promotions.
ondc buyer app pricing dynamics
- Potential for lower listed prices: If the buyer app charges lower commissions and fewer promotional fees, restaurants can pass savings to consumers or preserve margins.
- Competition-driven discounts: Multiple buyer apps can create price competition that benefits consumers — however, this requires scale and effective discovery for merchants.
- Transparency: Open networks can facilitate clearer breakdowns of delivery and service fees, improving trust.
Data point: Industry estimates indicate delivery fees can add 5–15% to the consumer bill on average, and surge pricing can temporarily add 10–30% during peaks.
Consumer example
Consider a Rs 400 order:
- Aggregator route: Rs 400 food + Rs 30 delivery + surge Rs 50 = Rs 480 (20% extra)
- ondc buyer app route (lower-fee model): Rs 400 food + Rs 20 delivery = Rs 420 (5% extra)
If the restaurant reduces the menu price by 5% to pass savings, the consumer pays even less through the lower-fee channel.
5. Restaurant control
Control over listings, promotions, customer data, and pricing is critical for restaurants aiming to build direct relationships and improve unit economics.
Control on aggregators
- Listing and promotional control: Aggregators control placement, search ranking, and many promotional levers; restaurants often pay to access prime visibility.
- Data limitations: Aggregators typically limit merchant access to end-customer contact data, hindering restaurants’ ability to build direct relationships.
- Operational standards: Aggregators enforce packaging, SLA, and quality standards; this ensures consistency but can constrain flexibility.
Control on ondc buyer apps
- Greater ownership potential: Open-network buyer apps can provide restaurants more direct access to orders, with options to integrate their own POS and CRM systems.
- Data portability: The open model encourages interoperability and data portability, allowing restaurants to capture customer information and build loyalty programs.
- Self-managed logistics: Restaurants can choose their delivery providers, including in-house delivery, if they prefer more control over customer experience.
Data point: Restaurants that capture even 10–20% of their orders through direct or low-fee channels often see improvements in customer retention and margin, primarily because they reduce dependency on paid promotions and high commissions.
6. Verdict — which is better for restaurants and consumers?
Short answer: There’s no one-size-fits-all winner. The best choice depends on your priorities: acquisition speed, margin preservation, UX expectations, and logistics sophistication.
When Swiggy & Zomato (aggregators) are the better choice
- Rapid customer acquisition: If your priority is fast brand discovery and scale, aggregators provide the largest demand pools; combined market share is roughly 90–95% in many Indian cities (Statista).
- Proven logistics: Aggregators deliver consistent, predictable delivery performance in many urban markets.
- Marketing reach: If you rely on platform promotions to drive volume, aggregators make sense despite higher commissions.
When an ondc buyer app route is better
- Margin focus: If reducing commissions and preserving margins is critical, lower-fee buyer apps and open-network options can offer meaningful savings.
- Data & customer ownership: Restaurants that want direct customer relationships and data portability benefit from open-network approaches.
- Strategic diversification: Using multiple buyer apps reduces dependency on a single aggregator and spreads risk.
Recommended hybrid approach
Most restaurants will benefit from a hybrid strategy:
- Use aggregators for reach and high-volume discovery.
- Use ondc buyer app channels or direct ordering for margin-rich customers and loyal repeaters.
- Monitor order economics regularly; shift promotional budgets to channels that yield the best return on ad spend (ROAS).
This approach balances acquisition, margin, and control while letting restaurants optimize per-market decisions.
Conclusion
Both models — traditional aggregators and ondc buyer apps — have clear advantages. Aggregators provide scale, polished UX, and strong logistics, but often at the cost of higher commissions (commonly in the 15–30% range). Open-network buyer apps promise lower fees, better data portability, and more control for restaurants, but realize those benefits only with good buyer-app execution and logistics partnerships. For consumers, lower-fee channels can mean lower prices, but consistent delivery performance and app polish remain critical. The practical takeaway: diversify channels, measure unit economics by channel, and prioritize customer experience while protecting margins.
Frequently Asked Questions (FAQs)
1. What is an ondc buyer app and how does it differ from an aggregator app?
An ondc buyer app is a marketplace front-end built to access multiple sellers via an open network (the term here refers to the open-network buyer-app model). Unlike aggregator apps that control the entire buyer-seller-logistics stack, buyer apps on an open network route orders across interoperable seller and logistics providers. The practical differences are in fees, data control, and choice of logistics partners.
2. Do restaurants actually pay less commission on ondc buyer apps?
Yes, many open-network buyer apps aim to charge lower platform fees (often single-digit percentages) because they reduce intermediary markups and separate discovery from logistics. Actual savings vary by buyer app, contract terms, and optional promotional services.
3. Will delivery times be slower on an ondc buyer app?
Not necessarily. Delivery speed depends on the logistics partner and routing algorithms. If the buyer app integrates strong local fleets or aggregator logistics, delivery times can match aggregator performance. Conversely, poorly integrated logistics can lead to slower deliveries.
4. Can consumers get cheaper prices through ondc buyer apps?
Potentially. Lower merchant commissions allow restaurants to offer lower menu prices or avoid price markups. However, price levels also depend on buyer app subsidies, competition, and operational costs.
5. Are there trade-offs to using multiple buyer apps alongside aggregators?
Yes. While diversification reduces dependency, it increases operational complexity: multiple order streams, inventory syncing, and fleets to manage. Investing in POS integrations and order management systems helps mitigate this complexity.
6. How should small restaurants approach channel selection?
Prioritize a hybrid approach: be present on major aggregators for reach, and build low-cost or direct channels (including buyer apps with lower fees) for margin preservation. Track order-level economics (cost per order, margin, acquisition cost) and adjust accordingly.
7. Will price transparency be better on open-network buyer apps?
Open networks are designed for interoperability and can support better fee transparency. Yet actual transparency depends on implementation and legal/regulatory requirements. Consumers and restaurants should review fee breakdowns per order.
8. How can restaurants measure if switching a share of orders to an ondc buyer app is working?
Track these KPIs:
- Average commission per order
- Average delivery time and customer ratings
- Repeat order rate and customer acquisition cost
- Net margin per order after all fees and delivery costs
Run controlled A/B tests and compare similar days/times to isolate effects.
References
- Statista – Market share of leading online food delivery players in India
- McKinsey – How COVID-19 is changing the restaurant industry (insights on delivery growth)
- HubSpot – Conversion and personalization insights for digital commerce
- Nielsen Norman Group – UX metrics and their business impact
- Economic Times – Food delivery sector reporting (commissions, fees, and industry news)